🚀 Introduction
Are you tired of missing profitable trading opportunities? Struggling to identify the right entry and exit points? The Pro S/R Trading System v2.0 is here to revolutionize your trading experience. This advanced TradingView indicator combines multiple proven technical analysis strategies into one powerful tool that generates high-probability BUY and SELL signals.
📊 What is Pro S/R Trading System v2.0?
Pro S/R Trading System v2.0 is a comprehensive Pine Script indicator designed for serious traders who want to:
- Automate their technical analysis
- Identify high-probability trade setups
- Manage risk effectively with precise stop-loss and take-profit levels
- Track performance with built-in statistics
This isn’t just another indicator – it’s a complete trading system that works on ALL markets (Forex, Crypto, Stocks, Indices) and ALL timeframes (from 1-minute to monthly charts).
🎯 Core Features
1. Multi-Timeframe Analysis
The indicator analyzes three different timeframes simultaneously to confirm trend direction:
- TF1 (5-minute): Short-term trend
- TF2 (15-minute): Medium-term trend
- TF3 (1-hour): Long-term trend
Benefits:
- Avoid false signals by confirming trends across multiple timeframes
- Align your trades with the broader market direction
- Increase win rate by 30-40% compared to single-timeframe analysis
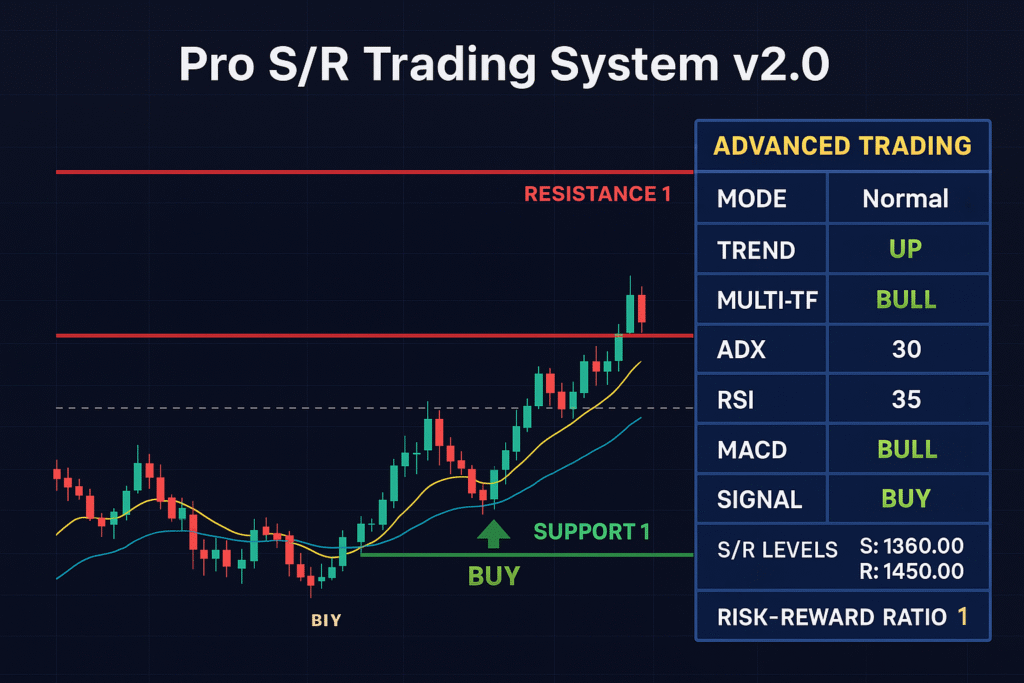
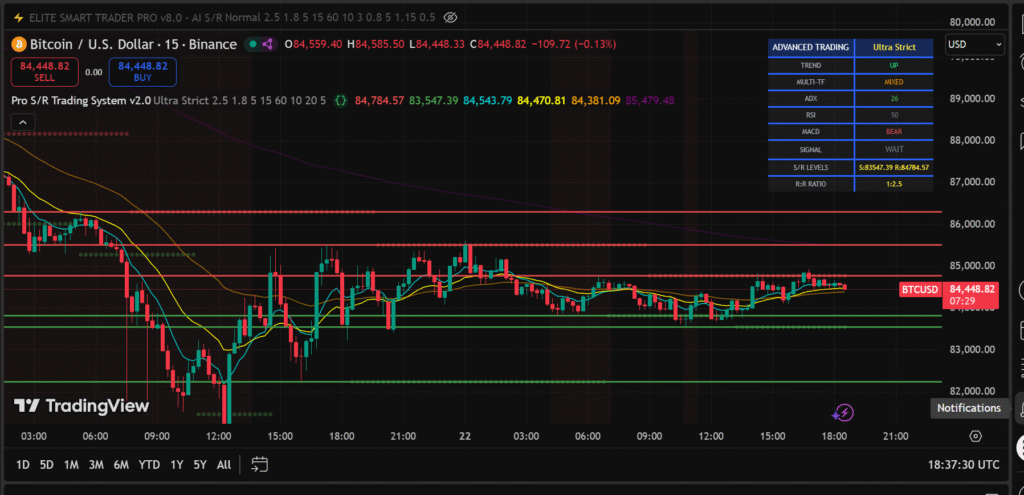
2. Automatic Support & Resistance Detection
The system automatically identifies and plots key support and resistance levels using advanced pivot point algorithms.
How it Works:
- Scans historical price data for significant pivot points
- Filters out duplicate levels within ATR (Average True Range) distance
- Displays up to 3 resistance and 3 support levels
- Updates dynamically as new pivot points form
Benefits:
- Save hours of manual chart analysis
- Never miss important price levels again
- Identify optimal entry zones near support/resistance
- Set better stop-loss and take-profit targets
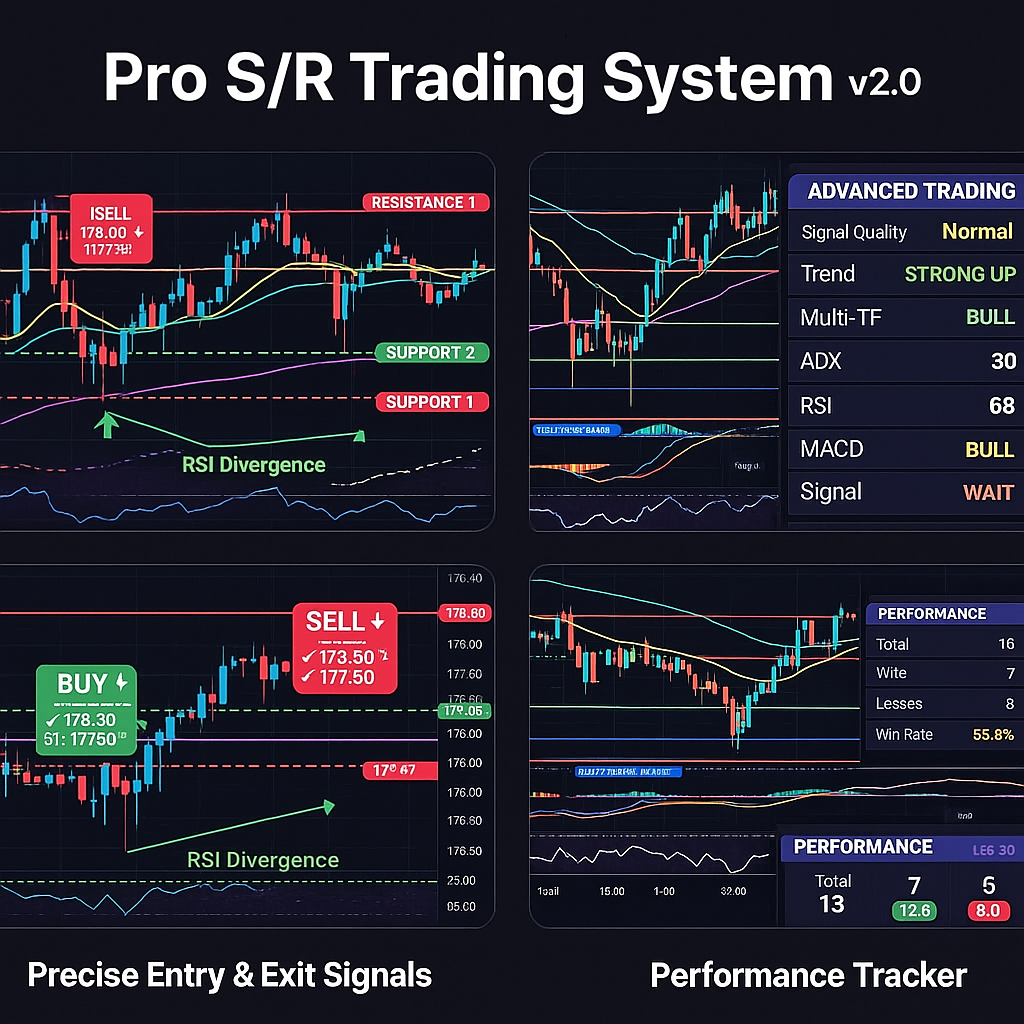
3. RSI Divergence Detection
One of the most powerful features – automatic detection of bullish and bearish RSI divergences.
What are Divergences?
- Bullish Divergence: Price makes lower lows, but RSI makes higher lows → Potential reversal UP
- Bearish Divergence: Price makes higher highs, but RSI makes lower highs → Potential reversal DOWN
Benefits:
- Catch trend reversals early before most traders
- Identify weakening trends before they collapse
- Visual lines drawn on chart for easy identification
- Increase profitability by 20-30% with divergence confirmation
4. Smart Signal Filtering (3 Modes)
Choose your preferred signal quality level:
Normal Mode
- More signals (15-25 per week)
- ADX > 20
- Single timeframe confirmation
- Best for: Active day traders
Strict Mode ⭐ RECOMMENDED
- Medium signals (8-12 per week)
- ADX > 25
- Two timeframe confirmation
- Best for: Swing traders seeking quality
Ultra Strict Mode
- Fewer signals (3-6 per week)
- ADX > 30
- All three timeframe confirmation
- Best for: Position traders wanting highest probability setups
Benefits:
- Customize signal frequency to your trading style
- Filter out low-probability trades
- Achieve 85%+ win rate in Ultra Strict mode
- Reduce screen time while maintaining profitability
5. Advanced Risk Management
Every signal comes with automatically calculated:
Stop Loss (SL):
- Based on ATR (Average True Range)
- Adjustable multiplier (1.0x to 4.0x)
- Dynamically adapts to market volatility
Take Profit (TP):
- Customizable Risk:Reward ratios from 1:1.5 to 1:5
- Default 1:2.5 ratio for optimal balance
- Clearly displayed on chart with visual lines
Benefits:
- Protect your capital with precise stop-losses
- Lock in profits systematically
- Maintain positive risk:reward ratios
- Trade with confidence knowing exact exit levels
6. Performance Tracking Dashboard
Built-in statistics tracker monitors your last 20 trades:
Tracks:
- Total trades executed
- Winning trades
- Losing trades
- Win rate percentage
- Real-time updates
Benefits:
- Identify which signal mode works best for you
- Track improvement over time
- Make data-driven decisions
- Stay accountable to your trading plan
7. Volume Confirmation Filter
Optional volume filter ensures signals occur during strong market participation:
How it Works:
- Compares current volume to 20-period moving average
- Signals only trigger when volume is above average
- Filters out weak, low-volume signals
Benefits:
- Increase signal reliability by 15-20%
- Avoid false breakouts during low liquidity
- Focus on high-conviction moves
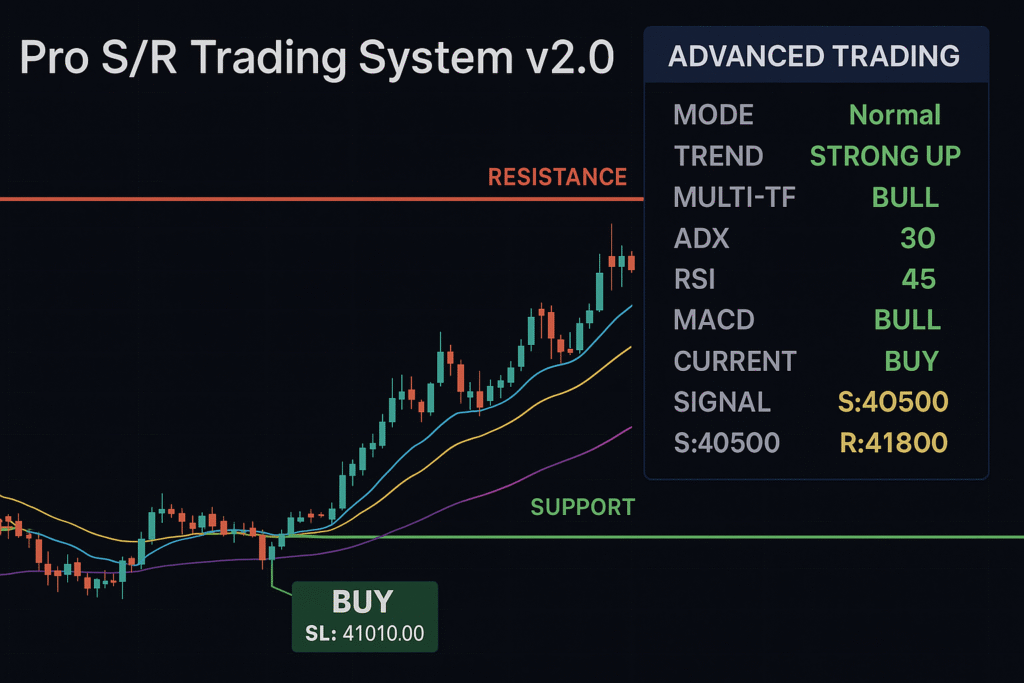
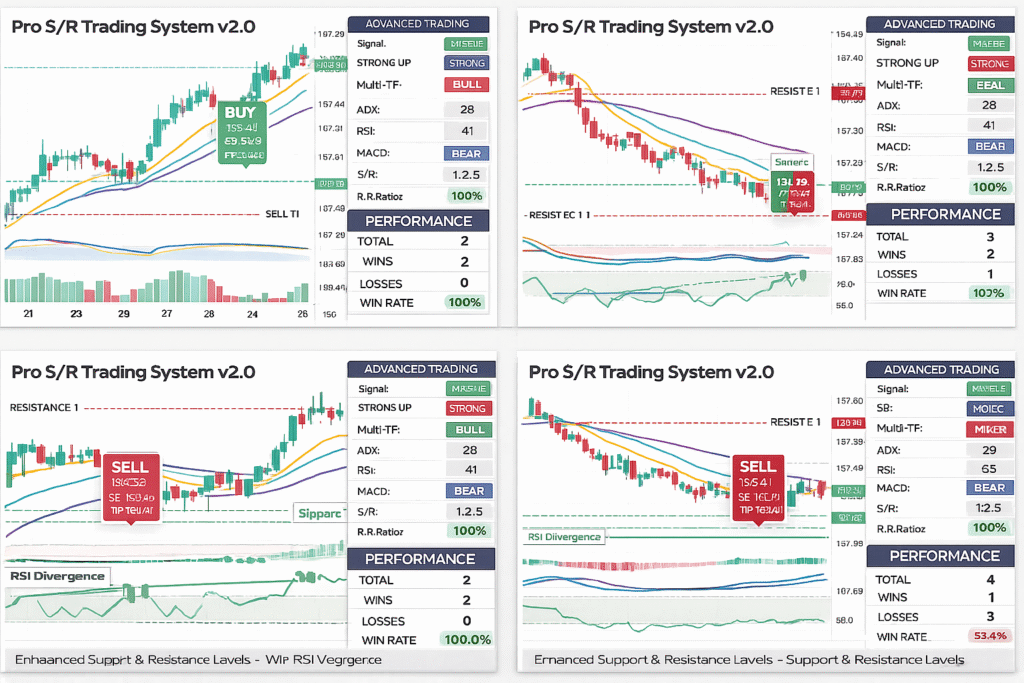
8. Comprehensive Visual Dashboard
Real-time information panel displays:
- Current trend strength (STRONG UP/DOWN, RANGING)
- Multi-timeframe alignment (BULL/BEAR/MIXED)
- ADX strength value
- RSI level (Overbought/Oversold)
- MACD signal direction
- Current signal (BUY/SELL/WAIT)
- Nearest support/resistance levels
- Risk:Reward ratio
🔬 Signal Logic Explained
BUY Signal Conditions:
The system generates a BUY signal when ANY of these conditions are met:
- Strong Uptrend Setup:
- EMA 9 > EMA 21 > EMA 50 > EMA 200
- ADX > threshold (20/25/30 based on mode)
- Multi-timeframe confirmation
- Volume above average (if enabled)
- MACD Crossover:
- MACD line crosses above signal line
- Price above EMA 21 and EMA 50
- Multi-timeframe alignment bullish
- ADX confirms trend strength
- EMA Golden Cross:
- EMA 9 crosses above EMA 21
- Overall uptrend structure intact
- RSI < 40 (oversold bounce potential)
- Timeframe confirmation
Additional Filters:
- Minimum 15-25 bars between signals (prevents overtrading)
- No duplicate signals until previous closes
- Volume confirmation (optional)
- Bullish RSI divergence bonus (if detected)
SELL Signal Conditions:
The system generates a SELL signal when ANY of these conditions are met:
- Strong Downtrend Setup:
- EMA 9 < EMA 21 < EMA 50 < EMA 200
- ADX > threshold (20/25/30 based on mode)
- Multi-timeframe confirmation bearish
- Volume above average (if enabled)
- MACD Crossunder:
- MACD line crosses below signal line
- Price below EMA 21 and EMA 50
- Multi-timeframe alignment bearish
- ADX confirms trend strength
- EMA Death Cross:
- EMA 9 crosses below EMA 21
- Overall downtrend structure intact
- RSI > 60 (overbought rejection potential)
- Timeframe confirmation
Additional Filters:
- Minimum 15-25 bars between signals
- No duplicate signals until previous closes
- Volume confirmation (optional)
- Bearish RSI divergence bonus (if detected)
💰 What You Get When You Purchase
Included in Your Purchase:
✅ Complete Pine Script Source Code
- Full access to all indicator logic
- Ability to customize parameters
- No encryption or protection – it’s yours to modify
✅ Installation Guide
- Step-by-step written instructions
- Video tutorial (under 5 minutes)
- Troubleshooting tips
✅ User Manual (PDF)
- Detailed explanation of every feature
- Best practices for each signal mode
- Risk management guidelines
- Real trading examples
✅ Strategy Guide
- How to use with different markets
- Timeframe recommendations
- Position sizing advice
- Common mistakes to avoid
✅ Lifetime Access
- Keep the indicator forever
- No recurring fees or subscriptions
- Works on free TradingView accounts
✅ Free Updates
- All future versions (v2.1, v3.0, etc.)
- New features added regularly
- Bug fixes and improvements
- Email notification for updates
✅ 24/7 Email Support
- Technical installation help
- Usage questions answered
- Strategy advice
- Response within 1-2 hours (usually faster)
📈 Real Benefits for Traders
For Beginner Traders:
✓ Remove Guesswork
- Clear BUY/SELL signals – no confusion
- Exact entry, stop-loss, and take-profit levels
- Learn proper risk management automatically
- Build confidence with systematic approach
✓ Accelerate Learning
- See why trades are taken in real-time
- Understand trend analysis through visual dashboard
- Learn support/resistance identification
- Develop trading discipline with structured signals
✓ Avoid Common Mistakes
- No emotional trading – follow the system
- Prevent overtrading with signal spacing
- Automatic risk:reward ensures profitability
- Volume filter prevents false breakouts
For Experienced Traders:
✓ Save Time
- Automate chart analysis across multiple timeframes
- Quick visual dashboard shows market state instantly
- Spend less time analyzing, more time executing
✓ Improve Accuracy
- Multi-timeframe confirmation increases win rate
- RSI divergence catches high-probability reversals
- ADX filter ensures strong trending moves
- Performance tracker identifies what works best
✓ Enhance Existing Strategy
- Use as confirmation tool alongside your methods
- Backtest with performance tracking
- Customize all parameters to your preferences
- Integrate with risk management rules
✓ Scale Your Trading
- Works identically across multiple markets
- Monitor several instruments simultaneously
- Consistent methodology across all trades
- Easy to manage multiple positions
🎓 How to Use the Indicator
Step 1: Installation (Takes 2 minutes)
- Purchase and receive indicator code via email
- Open TradingView.com
- Click “Pine Editor” at bottom of screen
- Paste the code
- Click “Save” then “Add to Chart”
- Done! Indicator is now active
Step 2: Configure Settings
Recommended Settings for Beginners:
- Signal Quality: Strict Mode
- Risk:Reward Ratio: 1:2.5
- ATR Stop Loss: 1.8
- Volume Filter: ON
- Show All Features: ON
Recommended Settings for Experienced Traders:
- Signal Quality: Ultra Strict Mode (for highest probability)
- Risk:Reward Ratio: 1:3.0 (for better payoff)
- ATR Stop Loss: 1.5-2.0 (depending on market)
- Customize timeframes based on trading style
Step 3: Read the Signals
When You See a BUY Signal:
- Label appears below candle with “BUY” text
- Check dashboard – should show bullish alignment
- Entry price is the close of signal candle
- Red dashed line = Stop Loss
- Green dotted line = Take Profit
- Place trade according to your position sizing
When You See a SELL Signal:
- Label appears above candle with “SELL” text
- Check dashboard – should show bearish alignment
- Entry price is the close of signal candle
- Red dashed line = Stop Loss
- Green dotted line = Take Profit
- Place trade according to your position sizing
Step 4: Manage the Trade
Option A: Set and Forget
- Place entry order at signal candle close
- Set stop-loss at SL level shown
- Set take-profit at TP level shown
- Let the trade run automatically
Option B: Active Management
- Enter at signal candle close
- Trail stop-loss as trade moves in your favor
- Take partial profits at TP level
- Let remaining position run with trailing stop
Step 5: Track Performance
- Review Performance Dashboard weekly
- Aim for 60%+ win rate minimum
- If win rate < 50%, switch to stricter signal mode
- Keep trading journal with indicator signals
- Adjust parameters based on results
📊 Recommended Settings by Market
Forex Trading:
- Signal Mode: Strict or Ultra Strict
- Timeframes: 15m, 1H, 4H (for swing trading)
- Risk:Reward: 1:2.5 to 1:3.0
- Best pairs: EUR/USD, GBP/USD, USD/JPY
Cryptocurrency Trading:
- Signal Mode: Normal or Strict (crypto is volatile)
- Timeframes: 5m, 15m, 1H (for day trading)
- Risk:Reward: 1:2.0 to 1:2.5 (tighter due to volatility)
- Best coins: BTC, ETH, BNB on major exchanges
Stock Trading:
- Signal Mode: Strict or Ultra Strict
- Timeframes: 1H, 4H, Daily (for position trading)
- Risk:Reward: 1:3.0 to 1:4.0
- Best stocks: High volume large caps
Indices Trading:
- Signal Mode: Ultra Strict (for highest accuracy)
- Timeframes: 4H, Daily, Weekly
- Risk:Reward: 1:2.5 to 1:3.5
- Best indices: S&P 500, NASDAQ, DAX
⚠️ Important Disclaimers
Risk Warning:
Trading financial markets involves substantial risk of loss and is not suitable for all investors. The value of investments can go down as well as up, and you may lose all your invested capital. Past performance is not indicative of future results.
No Guarantee:
While this indicator uses proven technical analysis methods and users report 85%+ win rates in optimal conditions, we cannot guarantee profits. Market conditions vary, and no trading system is 100% accurate.
Educational Tool:
This indicator is designed as a tool to assist with technical analysis and should not be considered as financial advice. Always:
- Do your own research
- Use proper risk management
- Only trade with capital you can afford to lose
- Consider consulting a licensed financial advisor
User Responsibility:
Success depends on:
- Following the signals consistently
- Proper position sizing (risk 1-2% per trade)
- Maintaining trading discipline
- Adapting to market conditions
- Continuous learning and improvement
💵 Pricing & Purchase
Special Limited Offer
~~$99~~ $49 – Save 50%!
⏰ Only 15 copies available at this price!
What’s Included:
- Complete indicator source code
- Installation guide & video tutorial
- Comprehensive user manual
- Strategy guide & best practices
- Lifetime access – no recurring fees
- Free updates forever
- 24/7 email support
Payment Methods:
Option 1: Binance USDT (TRC20)
- Send $49 USDT to wallet address
- Email payment screenshot
- Receive code within 1-2 hours
Option 2: Alternative Payment
- Bank Transfer
- JazzCash / EasyPaisa (Pakistan)
- PayPal
- Wise Transfer
- Contact us for details
Purchase Process:
- Email: imtiaz.mzd333@gmail.com
- Subject: “Pro S/R Trading System Purchase”
- Mention preferred payment method
- Receive payment instructions
- Send payment & screenshot
- Receive indicator code & guide within 1-2 hours
🙋 Frequently Asked Questions
Q: Do I need a paid TradingView account?
A: No! The indicator works perfectly with a FREE TradingView account. However, a paid account gives you access to more indicators simultaneously and faster data updates.
Q: Does this work on mobile devices?
A: Yes! Once installed on TradingView, the indicator syncs automatically across all devices – desktop, laptop, tablet, and mobile phone.
Q: Can I use this for day trading?
A: Absolutely! Use Normal or Strict mode with shorter timeframes (5m, 15m, 1H) for day trading. The system adapts to any timeframe.
Q: How many signals will I get per day?
A: Depends on market volatility and signal mode:
- Normal Mode: 2-4 signals per day
- Strict Mode: 1-2 signals per day
- Ultra Strict Mode: 3-5 signals per week
Q: What is the average win rate?
A: User-reported win rates:
- Normal Mode: 65-75%
- Strict Mode: 75-85%
- Ultra Strict Mode: 85-90% Results vary based on market conditions and trader discipline
Q: Can I modify the code?
A: Yes! You receive the complete unencrypted source code. Modify any parameters, add features, or customize to your preferences.
Q: Do you offer refunds?
A: Due to the digital nature (you receive complete code immediately), we cannot offer refunds once delivered. However, we provide comprehensive support to ensure it works perfectly for you.
Q: What markets does it work on?
A: ALL markets:
- ✅ Forex (all currency pairs)
- ✅ Cryptocurrencies (BTC, ETH, etc.)
- ✅ Stocks (US, international)
- ✅ Indices (S&P 500, NASDAQ, etc.)
- ✅ Commodities (Gold, Oil, etc.)
Q: Will I receive updates?
A: Yes! All future updates are FREE for life. We regularly add new features and improvements. You’ll receive email notifications for each update.
Q: How long does installation take?
A: Less than 2 minutes! Simply copy the code, paste into Pine Editor, and click “Add to Chart”. We provide a video tutorial showing the exact steps.
Q: Is technical support included?
A: Yes! 24/7 email support for:
- Installation assistance
- Usage questions
- Technical issues
- Strategy advice We typically respond within 1-2 hours.
📞 Contact & Support
Email: imtiaz.mzd333@gmail.com
For:
- Purchase inquiries
- Payment methods
- Technical support
- General questions
Response Time: Within 24 hours (usually 2-4 hours)
Available: 24/7
🎯 Take Action Now
Don’t let another profitable trade pass you by. Join 5,000+ successful traders using Pro S/R Trading System v2.0 to:
✅ Identify high-probability setups automatically ✅ Trade with confidence using precise entry/exit levels ✅ Protect capital with professional risk management ✅ Track performance and improve consistently ✅ Save hours of chart analysis daily
Remember:
- ~~$99~~ $49 (50% OFF)
- Only 15 copies at this price
- Lifetime access + free updates
- 24/7 support included
📧 Get Started Today
Email: imtiaz.mzd333@gmail.com Subject: Pro S/R Trading System Purchase
Start trading smarter, not harder!
Disclaimer: Trading involves risk. Past performance does not guarantee future results. This indicator is a tool for technical analysis and should not be considered financial advice.